Choosing the right Turbidity Sensor starts with a clear question: what decision must its reading support? A drinking-water operator may need reliable low-level measurements, while a wastewater team may face rapid swings and heavier suspended solids. The same instrument rarely suits every job. As measurement scientist Lord Kelvin put it, “When you can measure what you are speaking about, and express it in numbers, you know something about it.” His principle is useful here, though it does not replace practical sensor testing.
Compare the sensor’s measurement range, accuracy, response time, and optical design with real process conditions. Check whether bubbles, color, sunlight, or deposits could distort readings. A sensor that performs well in a clean sample may struggle beside a turbulent tank outlet. Ask how often it needs cleaning, whether calibration is straightforward, and how easily staff can verify readings against a reference method. Small details matter. A wiper can reduce buildup, but it cannot fix poor installation. Neither can a broad measurement range guarantee useful precision at the values you care about.
This guide will help you weigh sensor technologies, installation points, maintenance needs, and total operating costs. It will also examine trade-offs that product summaries often gloss over. For example, a lower purchase price may mean more frequent cleaning or less convenient diagnostics. Real-world conditions are messy. No selection checklist can predict every site-specific problem, so pilot testing remains valuable. The best choice is the one that produces dependable, interpretable data in your process—not simply the one with the longest feature list.
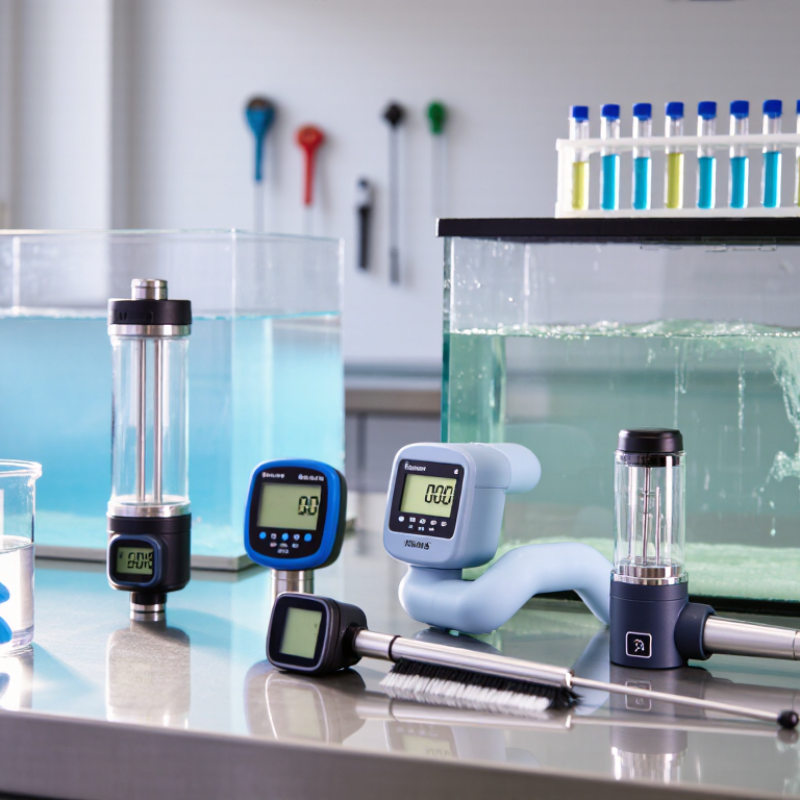
Start with the decision the measurement must support. Is the sensor tracking river changes, checking a filter, or triggering an operational alarm? These tasks need different measuring ranges, response times, and alert thresholds. A sensor installed after filtration may need to detect small changes that a raw-water monitor can safely overlook.
Published limits help define the target. The WHO Guidelines for Drinking-water Quality state that turbidity should be below 1 NTU for effective disinfection; lower levels are preferable. The U.S. EPA Surface Water Treatment Rules require conventional and direct filtration systems to keep combined filter-effluent turbidity at or below 0.3 NTU in at least 95% of monthly measurements, with a 1 NTU maximum. That matters.
Record expected minimum and maximum turbidity, temperature, solids, and cleaning frequency at the actual sampling point. Confirm that the instrument’s range and resolution suit the decision threshold, and check whether its optical method reports NTU or FNU. A clear calibration sheet cannot fix a poorly placed probe.
This part is often less tidy than the specification sheet: seasonal runoff, bubbles, and deposits can distort readings. Compare sensor trends with periodic reference samples, and document when results disagree.
Choosing a turbidity sensor starts with the water, not the instrument display. For clear drinking water or a clean process stream, a nephelometric sensor measures light scattered at an angle, commonly 90 degrees. It can detect small changes at low turbidity. Check the stated measuring range and reporting units; NTU and FNU values are not automatically interchangeable across methods.
As suspended particles increase, scattered light can become difficult to interpret. TransmissIon Sensors measure how much light passes through the sample, making them useful in more turbid water. Backscatter designs can suit dense sludge or wastewater, where particles quickly obscure a direct light path. The exact upper range varies by sensor. Verify it against expected peaks, not just a typical reading.
Field conditions matter. A creek sample may contain dark organic particles, while a treatment tank may trap air bubbles around the probe. Both can affect readings. Look for guidance on cleaning, calibration, and particle-size sensitivity, then test the sensor in the actual water if possible. The tidy split between “low-range” and “high-range” sensors is imperfect; real samples often shift with season or process changes.
I would leave some range headroom, even if that means giving up a little resolution.
A turbidity sensor should match both the sample and the place it will operate. Clear water, wastewater, and river water behave differently. Fine clay may remain suspended, while heavier particles settle before a reading. Choose a sensor range and optical design suited to expected turbidity, particle size, and sample color. The World Health Organization’s Guidelines for Drinking-water Quality (2022) notes that turbidity should be below 1 NTU before disinfection to support effective treatment. That benchmark is useful for treated water, but it is not a universal sensor-selection threshold.
Check the operating environment closely. Bubbles can scatter light and distort readings; vibration, sunlight, temperature swings, and fouling can also affect performance. In a river channel, changing flow may alter the particles reaching the sensor. In a tank, a mounting point near an inlet may capture a misleading spike. The USGS National Field Manual for the Collection of Water-Quality Data emphasizes careful field measurement and sample handling. Small details matter. I have seen a “sensor problem” turn out to be a sampling location problem. It is worth checking both before replacing equipment.
Tips: Match the sensor to the expected range, then verify it with representative samples. Keep the optical face clean, avoid trapped bubbles, and record temperature and flow conditions. If readings drift, inspect the installation before assuming the instrument has failed.
| Assessment Factor | Sample or Site Condition | Why It Matters | Sensor or Configuration to Consider | Practical Check |
|---|---|---|---|---|
| Expected turbidity range | Low-turbidity treated water, or highly turbid process water with suspended solids | Optical response and useful measurement range vary by sensor design. A sensor optimized for clear water may saturate in a concentrated slurry. | Choose a range that covers normal readings and expected peaks. For very turbid samples, consider a backscatter design; verify its specified range for the actual sample. | Collect representative samples at minimum, normal, and peak conditions. Confirm the sensor range and calibration method against a reference test. |
| Particle size and composition | Fine clay, silt, biological flocs, or coarse and settling particles | Particle size, shape, and refractive properties affect how light is scattered. Two samples with different solids can produce different turbidity readings at similar mass concentrations. | Use an optical method suited to the process and keep the measurement geometry consistent. Do not assume a universal conversion from NTU to suspended-solids concentration. | If solids concentration is the main target, develop and validate a site-specific correlation with laboratory measurements such as total suspended solids. |
| Color and dissolved substances | Colored water, dyes, or samples containing light-absorbing dissolved compounds | Absorption can reduce detected light and influence results, depending on the optical arrangement and sample properties. | Check the sensor’s measurement principle and interference guidance. Compare candidate sensors using the actual colored sample where possible. | Test across the expected color range and establish a reference procedure for the process matrix. |
| Bubbles and aeration | Air entrainment, foam, or frequent bubbles near the measurement point | Bubbles scatter light and can cause unstable or artificially elevated readings. | Select a location with a representative, steady sample and minimal entrained air. Consider a flow-through arrangement if it helps control bubbles. | Avoid mounting immediately downstream of a pump, air injector, or waterfall where possible. Check readings while aeration conditions change. |
| Fouling and deposits | Algae, biofilm, oil, grease, scale, or sticky process solids | Material on the optical window can block or scatter light, causing drift and increasing maintenance needs. | Consider an automatic wiper or another cleaning option compatible with the sample. Confirm window materials and cleaning requirements. | Estimate cleaning frequency from site experience, and include inspection and cleaning in the maintenance plan. |
| Temperature and pressure | Cold or hot process water, pressurized pipework, or changing process conditions | Operating limits are model-specific. Temperature or pressure outside the specified limits can affect performance or damage the sensor. | Verify the sensor’s documented temperature and pressure ratings, including any limits for fittings, seals, and cables. | Compare ratings with normal operation, cleaning cycles, and credible process excursions—not only average conditions. |
| Installation and flow | Open tank, channel, or closed pipe; variable flow or settling solids | Poor placement can lead to unrepresentative samples, air interference, sediment buildup, or difficult access. | Choose an immersion or flow-through installation suited to the process. Position the optical area in a well-mixed zone without contacting the tank or pipe wall. | Check sample representativeness, flow stability, access for removal, and whether solids settle at the proposed location. |
| Outdoor environment and maintenance access | Sunlight, rain, dust, vibration, washdown, or a hard-to-reach installation point | Environmental exposure and limited access can affect enclosure suitability, signal reliability, and the time required for service. | Check enclosure and connector ratings for the installation, cable routing, mounting stability, and access to the optical window. | Plan protection from direct impact and avoid mounting where routine inspection or cleaning cannot be performed safely. |
| Output and verification | Continuous process control, local display, or integration with a control system | The sensor must provide a usable signal and a repeatable measurement that can be checked over time. | Confirm required outputs, units, data logging needs, calibration procedure, and availability of suitable reference standards. | Define acceptance checks and a verification schedule before installation; document the sample conditions used for comparison. |
Note: Turbidity readings depend on sensor design, calibration, and sample properties. Confirm the selected sensor’s specifications and validate its performance with representative process samples.
Choosing a turbidity sensor means comparing accuracy, installation demands, and system compatibility—not just its smallest displayed number. U.S. EPA Method 180.1 describes nephelometric measurement across a 0–40 NTU range; higher readings require dilution. Check the sensor’s stated accuracy, repeatability, calibration process, and measurement range. Resolution is not accuracy. A practical compromise is rarely perfect.
Installation can change readings. Bubbles, sediment buildup, pipe vibration, and poor flow conditions may cause unstable measurements. For conventional or direct filtration, U.S. EPA Surface Water Treatment Rules set a 0.3-NTU benchmark for combined filter effluent. At least 95% of monthly measurements must meet it. Confirm that the sensor’s output, power supply, fittings, and cleaning needs suit your control system and sampling point. A highly accurate sensor can still underperform if its installation is awkward.
Tips: Before purchase, compare the datasheet with your actual water conditions. Ask how often calibration is needed, whether the sensor tolerates your temperature and pressure, and how quickly it responds to sudden turbidity changes. Test it beside a trusted reference instrument after installation. Field results may still surprise you.
Compare the measurement method, installation requirements, and system compatibility—not just the headline accuracy.
Measurement wavelength: ISO 7027-1 specifies near-infrared light at 860 nm. US EPA Method 180.1 specifies a tungsten lamp with a spectral peak between 400 and 600 nm; 500 nm is shown here as the midpoint of that range.
Installation and compatibility: Check that the sensor suits your expected turbidity range and process conditions. Install it where the sample is representative and bubbles are minimized; keep optical surfaces clean. Confirm that its output, power, mounting, and communication protocol match your control system. Accuracy and maintenance needs vary by sensor and application.
Plan for Calibration, Cleaning, and Ongoing Maintenance
A turbidity sensor is only useful when its readings stay trustworthy. Plan for calibration, cleaning, and service access before installation. Check whether staff can remove the probe easily and reach its optical surfaces without special tools. Fine sediment, algae, and bubbles can all distort readings. A spotless probe can still drift. USGS guidance on continuous water-quality monitoring recommends routine cleaning, calibration checks, and documented data corrections (Wagner et al., 2006, Techniques and Methods 1-D3).
Tips: Set a cleaning schedule based on actual site conditions, not a calendar alone. Inspect the sensor during each visit. Look for a cloudy film, trapped air, scratches, or loose fittings. Compare readings with a suitable turbidity standard, and record the result, date, and any adjustment. Small errors matter.
For treated drinking water, the US EPA’s Surface Water Treatment Rules set a benchmark for conventional and direct filtration: combined filter effluent turbidity must be 0.3 NTU or less in at least 95% of monthly measurements, and must never exceed 1 NTU. This makes calibration records and prompt maintenance especially important. Keep spare cleaning materials and a reference standard on hand. If readings shift after cleaning, investigate before assuming the water changed. A maintenance log can reveal patterns, though it cannot replace field judgment.
| Cookie | Duration | Description |
|---|---|---|
| cookielawinfo-checkbox-analytics | 11 months | This cookie is set by GDPR Cookie Consent plugin. The cookie is used to store the user consent for the cookies in the category "Analytics". |
| cookielawinfo-checkbox-functional | 11 months | The cookie is set by GDPR cookie consent to record the user consent for the cookies in the category "Functional". |
| cookielawinfo-checkbox-necessary | 11 months | This cookie is set by GDPR Cookie Consent plugin. The cookies is used to store the user consent for the cookies in the category "Necessary". |
| cookielawinfo-checkbox-others | 11 months | This cookie is set by GDPR Cookie Consent plugin. The cookie is used to store the user consent for the cookies in the category "Other. |
| cookielawinfo-checkbox-performance | 11 months | This cookie is set by GDPR Cookie Consent plugin. The cookie is used to store the user consent for the cookies in the category "Performance". |
| viewed_cookie_policy | 11 months | The cookie is set by the GDPR Cookie Consent plugin and is used to store whether or not user has consented to the use of cookies. It does not store any personal data. |